Investors are often seen choosing portfolios based on their preferences. Everyone decides how much risk to take, allocates between stocks and safe assets, and builds a portfolio that reflects their beliefs. But in reality, observed portfolios only tell part of the story. Many investors who could invest in stocks simply don’t, even when theory suggests they should. This paper presents a new perspective. Portfolio choices are not only driven by preferences, they are also shaped by frictions, marginal costs, inertia and default options. The result is a subtle but powerful mechanism. What investors hold is not always what they want. Understanding this gap is key to explaining how portfolios are actually formed.
What drives investors’ portfolio choices? Separation of risk preferences from frictions
- Taha Choukhmane, Tim De Silva
- Journal of Finance, 2026
- A version of this paper can be found here here
- Want to read our summaries of academic finance papers? Check out ourAcademic Research OverviewCATEGORY
Key academic insights
Most investors actually prefer stocks
The paper shows that over 90% of investors prefer to participate in the stock market. This is much higher than what we see in real-world portfolios. The gap suggests that non-participation is not primarily driven by risk aversion.
Defaults strongly influence behavior
Investors react very differently depending on how they are initially split. Those that have not been paid in safe assets are gradually transferred to shares. Those who have defaulted on shares rarely choose to withdraw. This asymmetry reveals preferences. Investors tend to hold stocks when they are offered, but delay action when they have to choose.
Trading behavior reveals hidden preferences
Active decisions are the main signal. Investors exiting default with zero equity reveal a preference for stocks. Investors moving away from equity find the opposite. By comparing these behaviors across different defaults, the paper recovers preferences that are otherwise unobservable.
Frictions, not risk aversion, drive non-participation
The model estimates a moderate level of risk aversion (≈ 2.5). At the same time, even a relatively small adjustment cost (~$156) enough to explain why many investors stay out of the market. This overturns the standard interpretation. Investors are not avoiding stocks because they fear them. They are avoiding it because acting is expensive.
Observed portfolios misrepresent true preferences
Observed participation rates are significantly lower than preferred participation. Similarly, observed equity allocations differ from preferred ones over the life cycle. This creates a wedge. What we see in the data is not what investors actually want.
Life cycle models match theory once frictions are removed
Preferences follow a standard pattern of high participation at all ages and exposure to equity that declines with age. The observed data do not match this. But once the frictions are accounted for, the behavior conforms to textbook life cycle models.
Practical applications for investment advisors
Rethink how portfolio choices are formed
Don’t assume portfolios reflect preferences. Many investors are underexposed to stocks not by choice, but because of inertia and friction.
Pay attention to standards
Initial allocations matter. They have long-term effects on portfolio results. Better default structuring can significantly improve investor behavior.
Reduce complexity wherever possible
Even small obstacles can prevent action. Simplifying decisions, reducing steps, and reducing cognitive load can help investors move closer to their preferred allocations.
Be careful when interpreting risk tolerance
Low equity exposure does not necessarily mean high risk aversion. It may reflect inaction rather than preference.
How to explain this to customers
“A lot of people think that if someone isn’t investing in stocks, it means they’re too risky. But that’s often not the case. In reality, most investors want to be invested in the market. They just don’t always take action. Sometimes because it feels complicated. Sometimes because they never get it. When people automatically invest, they usually stay invested. It shows that taking risk is the first step, but it’s not fear of fear.”
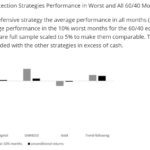
The most important chart from the paper
Figure 2 presents the observed portfolio responses for employees hired within 12 months of their employer changing their default asset allocation τ years after they were hired. The left panel shows the stock market participation rate and the right panel shows the unconditional average shares of current employer pension wealth stock. Blue lines are employees automatically enrolled in a money market fund; red lines are employees automatically registered in a TDF.

Results are hypothetical results and are NOT an indication of future results and do NOT represent returns actually achieved by any investor. Indices are not managed and do not reflect management or trading fees, and one cannot invest directly in an index.
ABSTRACT
This paper studies why many investors do not participate in the stock market despite a positive equity premium. It separates risk preferences from participation frictions using quasi-experimental variations in default 401(k) asset allocations. By comparing the behavior of investors according to different standards, the authors identify preferences from active choices. They find that most investors prefer participation in the stock market and exhibit moderate risk aversion, while limited participation is mainly driven by regulation frictions. The results highlight the importance of defaults, inertia, and marginal costs in shaping portfolio decisions and aligning observed behavior with standard life cycle models.
What drives investors’ portfolio choices? It’s not what you might think originally published in Alpha Architect. Please read the Alpha Architect FINDINGS at your convenience.