Momentum investing has been one of the most persistent and strange phenomena in finance for more than three decades. Traditional explanations usually focus on investor psychology, delayed information diffusion, or risk compensation. But this paper proposes something radically different. The authors argue that momentum gains are largely driven by the institutional mechanics of money management. Specifically, investors who need cash before the end of the month systematically sell their losers. And this predictable “dash to the money” creates a highly concentrated momentum effect during just six trading days each month.
Intramonth momentum cycle
- Daniel Nathan, Matti Suominen and Joni Tasa
- Working paper, 2026
- A version of this paper can be found here here
- Want to read our summaries of academic finance papers? Check out ourAcademic Research OverviewCATEGORY
Key academic insights
Momentum profits are concentrated in just six trading days
The paper finds that the vast majority of momentum gains are made during a narrow six-day trading window before the end of the month, called the PreTOM period. From 1980 to 2025, a current strategy implemented only during these days has dramatically outperformed the same strategy held during the rest of the month. This suggests that momentum is highly time-dependent rather than evenly distributed across trading days.
Momentum is mostly about losing losers
The results show that momentum gains are mainly driven by the underperformance of losing stocks rather than the strong performance of winners. During the PreTOM window, losing stocks experience significantly larger negative returns, while winners exhibit little unusual behavior. This asymmetry challenges many traditional explanations of momentum that assume symmetric effects on both sides of trade.
The mechanism is a predictable “dash for money”.
The authors argue that institutional investors regularly need cash before the end of the month, creating predictable selling pressure. When raising liquidity, investors tend to sell their losing positions first because they are psychologically easier to liquidate, often carry tax losses, and usually pay fewer dividends. Evidence from trade-level data and mutual fund flows strongly supports this explanation of liquidity management.
The T+1 settlement reform provides causal evidence
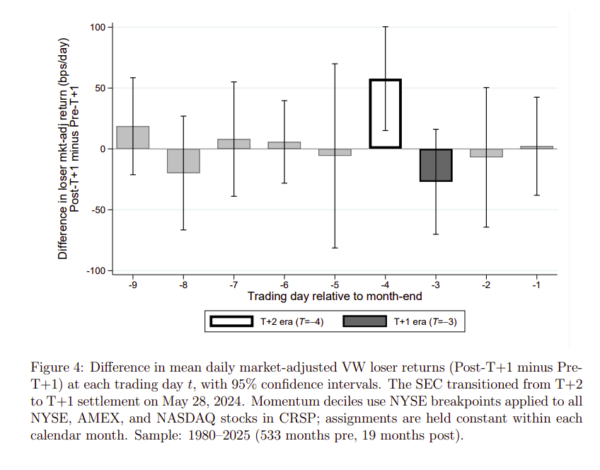
The SEC’s move from T+2 to T+1 settlement in May 2024 created a natural experiment for testing the theory. After the reform, the concentration of selling losing stocks moved exactly one trading day closer to the end of the month, consistent with the shorter settlement cycle. This time variation appeared in both stock returns and mutual fund data, providing extremely strong causal evidence for the proposed mechanism.
Momentum crashes occur in a different part of the month
The study shows that momentum crashes do not occur during the profitable PreTOM period. Instead, the risk of a crash is concentrated near the beginning of the month, while the strongest momentum gains occur before the end of the month. This breakdown shows that PreTOM’s earnings are not simply compensation for avoiding collisions, but reflect a distinct liquidity-driven process
The effect is strongest among liquid institutional stocks
The PreTOM effect is much stronger among highly liquid loser stocks, especially those heavily owned by institutions. Stocks with lower bid-ask spreads experience greater underperformance during periods of liquidity, which is consistent with institutions preferring to sell positions that can be traded cheaply and quickly. Non-liquid microcap stocks exhibit much weaker effects.
The effect lives on internationally
The paper documents similar patterns of PreTOM momentum in 19 developed international markets. In most countries, losing stocks have significantly underperformed over the same period before month-end, while gainers show little comparable behavior. The consistency across markets strengthens the argument that the phenomenon reflects institutional trading mechanics rather than country-specific behavioral biases.
Practical applications for investment advisors
Momentum may be structural rather than behavioral
The findings suggest that momentum is not simply driven by investor psychology or risk premiums. Institutional liquidity management can play a major role. This has important implications for how advisors interpret factor behavior.
Calendar time matters
Momentum returns are not evenly distributed throughout the month. Understanding when momentum gains historically occur can help advisors better interpret short-term factor performance and periods of apparent factor divergence.
Losing stocks can carry hidden liquidity risk
The paper notes that past losers can become liquidity providers during periods of institutional cash demand. This may help explain why the short side of momentum strategies often dominates performance.
Momentum crashes are distinct from momentum gains
Profit window and crash window are different. This distinction can be important for risk management, portfolio implementation, and understanding factor dilution.
How to explain this to customers
“Momentum investing can work in part because institutions behave predictably around the end of the month. When investors need money for repayment obligations or repayments, they often sell their losing positions early. This creates temporary selling pressure on losing stocks during a very specific part of the month. Over time, this repeated cycle helps generate momentum profits. The research may also reflect the psychology of risk or it doesn’t just suggest the timing of the investment, it’s how financial markets work.”
The most important chart from the paper
Results are hypothetical results and are NOT an indication of future results and do NOT represent returns actually achieved by any investor. Indices are not managed and do not reflect management or trading fees, and one cannot invest directly in an index.
ABSTRACT
The pace of US equity momentum is concentrated in just six trading days each month, the window ending four days before the end of the month. We show that this concentration arises from investors’ money: predictable end-of-month payment obligations create demand for cash, prompting investors to sell, and the stocks they sell are their losers. A value-weighted WML strategy invested over just these six days turns $1 into $18.78 over 1980–2025, compared to $2.37 over the rest of the month. The concentration is asymmetric: losers of the bottom decile underperform by an additional 7.2 basis points per day during the window, while winners do not show the corresponding pattern. The SEC’s transition in May 2024 from T+2 to T+1 capital redemption provides causal identification: the predicted one-day shift in the selling window is reflected in individual stock and mutual fund returns. Three episodes of acute outflows confirm the broader mechanism: when investors need money, they sell their losers; the same loser-driven pattern is repeated in 19 developed markets. The result also reviews the poor performance of Carhart’s lost fund: the momentum loading component is mainly realized in the PreTOM window, while the cost drag works throughout the month. Crashes are concentrated at the beginning of the month, not during PreTOM. The findings recast momentum as a feature of capital market hydraulics rather than a property of investor beliefs or price risk.
Intramonth momentum cycle originally published in Alpha Architect. Please read the Alpha Architect FINDINGS at your convenience.