Nusret Cakici, Christian Fieberg, Gabor Neszveda, Robert Bianchi and Adam Zaremba, authors of the January 2026 study “A Unified Framework for Anomalies based on Daily Returnschallenged the way we think about short-term return patterns in stock markets. Their research reveals that the wealth of information contained in daily stock returns is hidden in plain sight—and when properly extracted, generates tremendous predictive power for future performance.
What Researchers Examined
The academic literature is replete with anomalies that attempt to predict stock returns using recent daily price movements. Some focus on when returns occurred (like short-term return strategies), while others emphasize how extreme they were (like the MAX effect, which looks at maximum daily returns). But here’s the conundrum: all of these strategies come from the same raw material—the sequence of daily returns over the past month—yet each isolates only one specific aspect.
The authors asked a more fundamental question: What if we let the data tell us how to weight and combine the information from recent daily returns, rather than imposing arbitrary functional forms?
Using nearly a century of US stock data (1937-2024), they used machine learning techniques (net elastic regression) to systematically extract two essential dimensions from the previous month’s daily returns:
- Chronological Information: Time-ordered sequence of daily returns, capturing when returns occurred within the month.
- Ranking Information: Returns sorted by magnitude, capturing how extreme each daily result was relative to others in that month.
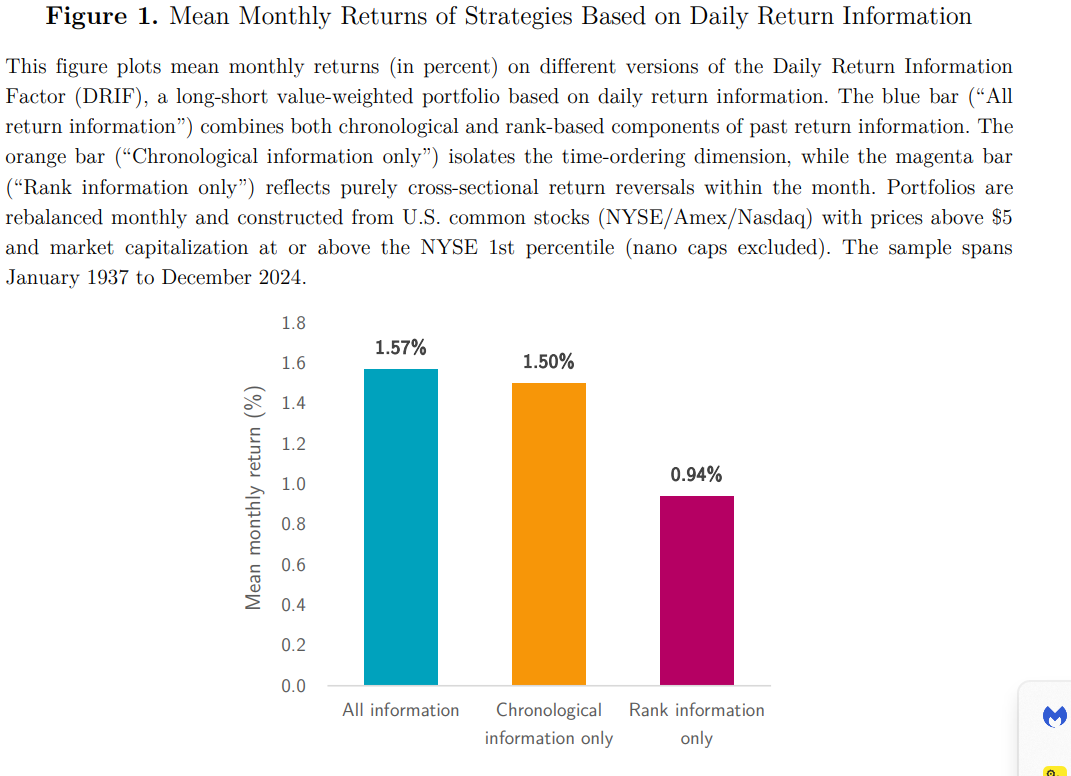
From these components, they constructed the daily return information signal (DRI) and its corresponding factor portfolio, the DRIF (Daily Return Information Factor).
Key findings
The results are convincing in many dimensions:
1. Strong return predictability
The DRIF strategy generates impressive performance:
- 1.57% monthly return (nearly 19% annualized) with a Sharpe ratio of 1.23.

- Abnormal return (six-factor alpha) of 1.60% per month after controlling for standard risk factors.
- Performance driven by both the long and short sides of the strategy.
- It offers larger spreads among smaller, lower-priced, less liquid firms. The premium also increases among companies with higher idiosyncratic volatility and more extreme recent returns, a pattern consistent with arbitrage limits reinforcing predictability.
2. Time matters more than size
When the signal is broken down, a clear hierarchy emerges:
- The ranking component (extreme results) adds incremental but smaller value – approximately 0.9% per month
- This suggests that investors largely respond recent price pressure and liquidity effects rather than behavioral responses to extreme outcomes
3. Amazingly strong
Premium survives many challenges:
- Continued to 2,304 alternative research designs (various sample definitions, methods and portfolio rules)
- It remains significant even in the modern era (2000-2024), gaining about 1% per month
- It works for large-cap stocks, not just small illiquid names
- It strengthens during periods of high volatility and high interest rates
4. Featured on “Factor Zoo”
Perhaps most impressively, DRIF stands up against the explosion of documented return predictors:
- Improves portfolio Sharpe ratios even after controlling for over 150 known anomalies
- Summarizes almost all short-horizon anomalies: volatility effects, MAX patterns, short-term variation, and lottery-style strategies lose their explanatory power once DRIF enters the model
- In systematic factor selection tests, DRIF is selected immediately after the market factor – ranking above momentum, value, size and profitability.
- The Bayesian model—averaged over 8.8 trillion possible specifications—identifies DRIF as having the highest probability of being a true risk factor
5. Practical and applicable
Despite the high turnover (~93% monthly), the strategy remains viable:
- Breakeven trading costs (36-42 basis points per trade) exceed typical institutional levels (10-20 bps per trade). Microcaps produced the highest thresholds: the value-weighted spread of microcaps supports approximately 83 basis points.
- Long-term only implementations show even better cost profiles
- Performance continues with one-day implementation delays
Key Investor Relations
1. Rethink short-term information
Investors should view recent daily returns as a rich and multidimensional source of information rather than focusing on single metrics. The traditional short-term return strategy captures only part of the picture. A systematic, data-driven approach yields significantly more predictive content.
2. Recency Is King
The dominance of chronological information tells us that the most recent price movements are more important for predicting next month’s returns. This is consistent with theories about temporary price pressure, liquidity provision, and market microstructure effects. The market seems to largely respond when events happen and not just they are.
3. This is not another weak anomaly
DRIF is not only statistically significant – it appears to be a fundamental driver of cross-returns. Its ability to absorb the explanatory power of the multiple anomalies found, to consistently rank as a major factor in systematic selection procedures, and to maintain significance across nearly a century of data, suggests that it represents an essential dimension of risk or mispricing that the market systematically prices.
4. Volatility regimes matter
The strategy works particularly well during turbulent periods of high VIX and high interest rates—precisely when liquidity pressures intensify and interim prices widen. This state dependence can inform decisions about tactical allocation.
5. Big hats are not excluded
Unlike many anomalies that fade between liquid and large-cap stocks, DRIF continues to generate significant returns even in the most tradable segment of the market. This suggests that the underlying forces are not simply arbitrage restrictions on small stocks, but reflect broader market dynamics.
conclusion
By taking a holistic, machine learning-driven approach to extracting information from daily returns, the authors have identified what appears to be a fundamental feature of how markets process information over short horizons.
For practitioners, the message is clear: the sequence and timing of recent daily returns contains powerful predictive information that simpler approaches miss. Whether you’re building factor portfolios, looking for sources of alpha, or simply trying to understand what drives short-term return patterns, the Daily Return Information Factor represents a breakthrough in the way we think about and exploit recent price history.
The fact that this model has persisted for nearly 90 years, survives modern statistical challenges, and prevails over established factors suggests that it captures something real and enduring about market dynamics—not just a statistical fluke waiting to disappear.
Larry Swedroe is the author or co-author of 18 books on investing, including his latest Enrich your future. He is also a consultant to RIAs as an educator on investment strategies.
–
Important discoveries
For informational and educational purposes only and should not be construed as specific investment, accounting, legal or tax advice. Some information is considered reliable, but its accuracy and completeness cannot be guaranteed. Third party information may become out of date or be replaced without notice. Neither the Securities and Exchange Commission (SEC) nor any other federal or state agency has approved, determined the accuracy, or confirmed the adequacy of this article.
The views and opinions expressed herein are those of the author and do not necessarily reflect the views of Alpha Architect, its affiliates, or its employees. Our full disclosures are available here. Definitions of common statistics used in our analysis are available here (in the last direction).
Join thousands of other readers and subscribe to our blog.