Most trend-following research focuses on signal building: how to detect trends better, faster, or earlier. The paper poses another question, and perhaps a more important one for investors: once a market regime has been identified, what is the optimal portfolio exposure to that regime?
This is the central innovation of the newspaper that is available here.
Traditional time series momentum strategies typically impose exposures mechanically. In the standard two-regime version, the investor is fully long in an uptrend and fully short in a downtrend. More recent approaches enrich the signal by introducing more regimes, but they still impose strong constraints on the portfolio weights. In other words, the literature has spent considerable effort on improving how to detect regimes, while paying much less attention to how to optimally position once those regimes are detected.
This document separates these two decisions. It takes the detected market regime as given and derives the Sharpe-optimal portfolio weight for each regime from first principles. The result is a simple and workable framework for regime-dependent optimal allocation that can be applied to any limited number of regimes. Standard trend-following rules then appear as special cases of the framework – and, in general, as suboptimal.
This change in perspective leads to a clear practical message: better trend following does not necessarily come from inventing another signal. It could come from more intelligently parsing through the regimes we already know how to detect.
Empirical results strongly support this idea. Across US stock market, US-style portfolios, international equity indices, and diversified portfolio implementations, the optimal regime-dependent strategy yields consistently higher out-of-sample Sharpe ratios than the standard time series moment and the dynamic velocity moment. A particularly important finding is that the full short exposure commonly used in bear regimes is often far from optimal. In many cases, the optimal market exposure is close to zero and sometimes even slightly positive. This is a great result because it challenges one of the most common assumptions embedded in trend following strategies.
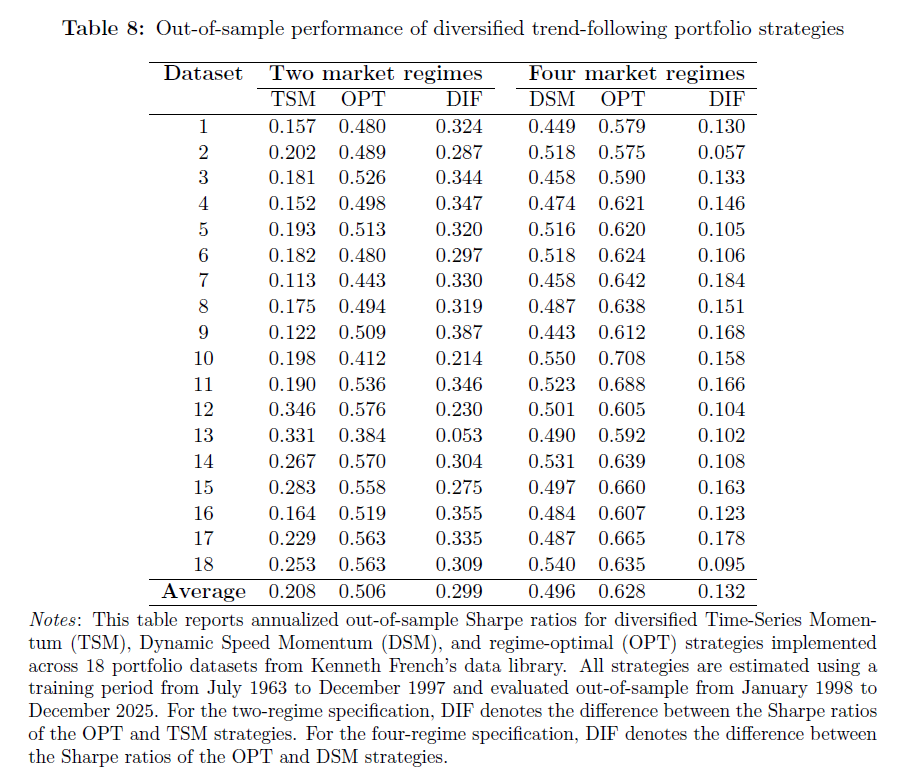
The following table illustrates the practical importance of the main idea of the paper. Across 18 diverse portfolio datasets, the optimal regime-dependent strategy outperforms the benchmark in every single case. In the two-regime environment—bull and bear markets—the strategy is compared to the Time Series Moment rule of Moskowitz, Ooi, and Pedersen (2012), and the average out-of-sample Sharpe ratio increases from 0.208 THE 0.506. In the setting of four regimes – bull, bear, correction and recovery – it is compared with the Dynamic Momentum of Speed strategy of Goulding, Harvey and Mazzoleni (2023), and the average Sharpe ratio increases from 0.496 THE 0.628. The implication is both simple and powerful: better trend following does not always require a better signal. It can also come from better positioning within regimes that current signals already detect.
Out-of-sample performance of diversified trend-following portfolio strategies
| The data set | Two market regimes | Four market regimes | ||||
| TSM | OPT | DIF | DSM | OPT | DIF | |
| 1 | 0.157 | 0.480 | 0.324 | 0.449 | 0.579 | 0.130 |
| 2 | 0.202 | 0.489 | 0.287 | 0.518 | 0.575 | 0.057 |
| 3 | 0.181 | 0.526 | 0.344 | 0.458 | 0.590 | 0.133 |
| 4 | 0.152 | 0.498 | 0.347 | 0.474 | 0.621 | 0.146 |
| 5 | 0.193 | 0.513 | 0.320 | 0.516 | 0.620 | 0.105 |
| 6 | 0.182 | 0.480 | 0.297 | 0.518 | 0.624 | 0.106 |
| 7 | 0.113 | 0.443 | 0.330 | 0.458 | 0.642 | 0.184 |
| 8 | 0.175 | 0.494 | 0.319 | 0.487 | 0.638 | 0.151 |
| 9 | 0.122 | 0.509 | 0.387 | 0.443 | 0.612 | 0.168 |
| 10 | 0.198 | 0.412 | 0.214 | 0.550 | 0.708 | 0.158 |
| 11 | 0.190 | 0.536 | 0.346 | 0.523 | 0.688 | 0.166 |
| 12 | 0.346 | 0.576 | 0.230 | 0.501 | 0.605 | 0.104 |
| 13 | 0.331 | 0.384 | 0.053 | 0.490 | 0.592 | 0.102 |
| 14 | 0.267 | 0.570 | 0.304 | 0.531 | 0.639 | 0.108 |
| 15 | 0.283 | 0.558 | 0.275 | 0.497 | 0.660 | 0.163 |
| 16 | 0.164 | 0.519 | 0.355 | 0.484 | 0.607 | 0.123 |
| 17 | 0.229 | 0.563 | 0.335 | 0.487 | 0.665 | 0.178 |
| 18 | 0.253 | 0.563 | 0.309 | 0.540 | 0.635 | 0.095 |
| Average | 0.208 | 0.506 | 0.299 | 0.496 | 0.628 | 0.132 |
Notes: This table reports annualized out-of-sample Sharpe ratios for diversified Time-Series Momentum (TSM), Dynamic Speed Momentum (DSM), and regime-optimal (OPT) strategies implemented across 18 portfolio datasets from Kenneth French's data library. All strategies are estimated using a training period from July 1963 to December 1997 and evaluated out of sample from January 1998 to December 2025. For the two-regime specification, DIF denotes the difference between the Sharpe ratios of the OPT and TSM strategies. For the four-regime specification, DIF denotes the difference between the Sharpe ratios of the OPT and DSM strategies.
For investment professionals, the paper’s utility is straightforward. It provides a transparent portfolio design framework for translating regime signals into economically justified position sizes. Instead of relying on arbitrary rules like “+1 in bull markets, -1 in bull markets,” investors can estimate regime-specific expected returns and risks and place them directly into optimal exposures. This has immediate relevance for tactical asset allocation, managed futures, CTA-style investing, and any systematic strategy that conditions exposure to market states.
References
Moskowitz, TJ, Ooi, YH, & Pedersen, LH (2012). “Moment of time series”. Journal of Financial Economics, 104(2), 228-250.
Goulding, CL, Harvey, CR, & Mazzoleni, MG (2023). “The turning point of the moment.” Journal of Financial Economics, 149(3), 378-406.
–
Important discoveries
For informational and educational purposes only and should not be construed as specific investment, accounting, legal or tax advice. Some information is considered reliable, but its accuracy and completeness cannot be guaranteed. Third party information may become out of date or be replaced without notice. Neither the Securities and Exchange Commission (SEC) nor any other federal or state agency has approved, determined the accuracy, or confirmed the adequacy of this article.
The views and opinions expressed herein are those of the author and do not necessarily reflect the views of Alpha Architect, its affiliates, or its employees. Our full disclosures are available here. Definitions of common statistics used in our analysis are available here (towards the end).
Join thousands of other readers and subscribe to our blog.